A Look Into VC Funding in 2019
From median capital raised to startup funding and revenue brackets this proprietary data report looks at the state of VC funding medians in 2019.
Table of Contents
Protect your business today!
Get a QuoteIn the age of unicorns, terms like “record-breaking” and “mega-rounds” are frequently used to describe the state of venture capital in the U.S., and rightfully so. What was once was a statistical rarity, mega-rounds seem to be commonplace in VC, especially when 2018 marked a new all-time high — investments that surpassed the $100 billion mark for the first time since the dot-com boom.
And while large-scale fundraising has produced a frenzy in the startup world, this data often fails to paint a comprehensive picture of VC medians and the state of successful startups that aren’t necessarily the next unicorn. In an effort to better understand venture capital in 2019, we’ve turned to our internal data to analyze company and funding patterns.
Never before published, this report looks at a sample of some of the thousands of startups we work with to highlight funding data like geographical differences in venture capital, funding and revenue averages, and the correlation between the size of startups and funding success. Based on our analysis, we’ve put together a digestible guide of charts and interactives, so you can better understand the state of VC in 2019.
***Information from this report is proprietary data of Embroker. Company names have been omitted for privacy and client relationships.
Mapping VC Funding
Silicon Valley has long been the capital for venture investment. After all, it makes sense that many startups would position themselves near California’s hotbed for innovation or set up shop next to Wall Street bulls who cut the majority of big checks. However, it’s also the hubs outside of Silicon Valley that are seeing significant proportions of venture investment.
To better understand the geographical distribution of funding, we split up the data by Seed, Series A, B, and C rounds to analyze revenue medians across nine different regions in the U.S. While the West Coast takes the lion’s share of capital invested at Series C rounds, it’s the earlier stage rounds that saw the most diversity in geographical placement.
Mountain Division
Median raised
Median revenue
Median employees
$1,673,554
$363
4
Select a region to view its stats
Diving into geographical data a bit further, we analyzed average revenues at the state level and noticed that seven states stood out as some of the best locations to raise venture capital based on the differences in average funding and average startup revenue.
States like Colorado showed significant gaps between the two factors where average funding raised was over $9.3 million yet the average startup revenue was significantly lower at $400,000. California and New York, where VC has long dominated, closed the funding to revenue gaps.
States With the Highest Funding Medians
Median Employees
Median Funding
Median Revenue

Washington
Massachussets
California
Colorado
New York
State of VC Funding by Industry
Over the past decade, the software, pharma, biotech industries have dominated deal making. In 2018 alone, the software sector saw a record level of capital investment, reaching $46.8 billion. Funding averages tell a different story. Real estate had the highest average funding raised at $18.9 million, followed by retail at $17.5 million and media at $16.2 million — software and biotech landed closer to the middle averages at $7.1 and $7.8 million.
Below we look at the average total of funding raised by industry and how this data correlates to each industry’s average revenues.
Median Funding vs. Median Revenue by Industry
Industry Success by Funding Round
When it comes to startup survival rates, more than 60 percent of startups stall in their fundraising — many failing to make it to Series A and beyond. And while there’s not typically one single round when companies plateau, it’s notoriously harder to rise through the ranks of venture capital. That said, some industries are more successful in making it to the upper echelons of the VC world.
Media-focused startups, for example, were the most successful, with a total average of over $88 million — $81.9 million of which was raised in Series B rounds. Fintech, internet, and hardware sectors followed in their average total of all rounds. Although fintech and services-focused startups moved on to Series C rounds, these funding rounds averaged out at $42 and $45 million.
To discover more about the averages, interact with the graph below by hovering over the bar to display various funding averages by round.
Of course, there are some industries that dominate in the ability to raise capital. The visualization below looks at funding totals by industry across the 470 startups analyzed.
Funding Round Average by Industry
Funding Brackets by Rounds
In evaluating the relationship between funding brackets and startups, we also looked at this on a round-by-round basis and discovered that the majority of startups at seed stage rounds (34 percent) raised funds that ranged in $2–5 million bracket.
40 percent of startups that moved onto Series A raised funds in the $5–10 million bracket. 42 percent that moved onto Series B raised funds in the $20 million+ bracket.
Of course, there are always outliers — 2 percent of startups fell within the $10–20 million funding bracket during the seed stage alone, a phase where the average early-stage business typically only raises tens of thousands of dollars. This percentage jumped to 20% as companies moved onto a Series A round.
Funding Brackets by Round
Seed Round Companies
Brackets
<1M
$1M-$2M
$2M-$5M
$5M-$10M
$10M-$20M
>20M
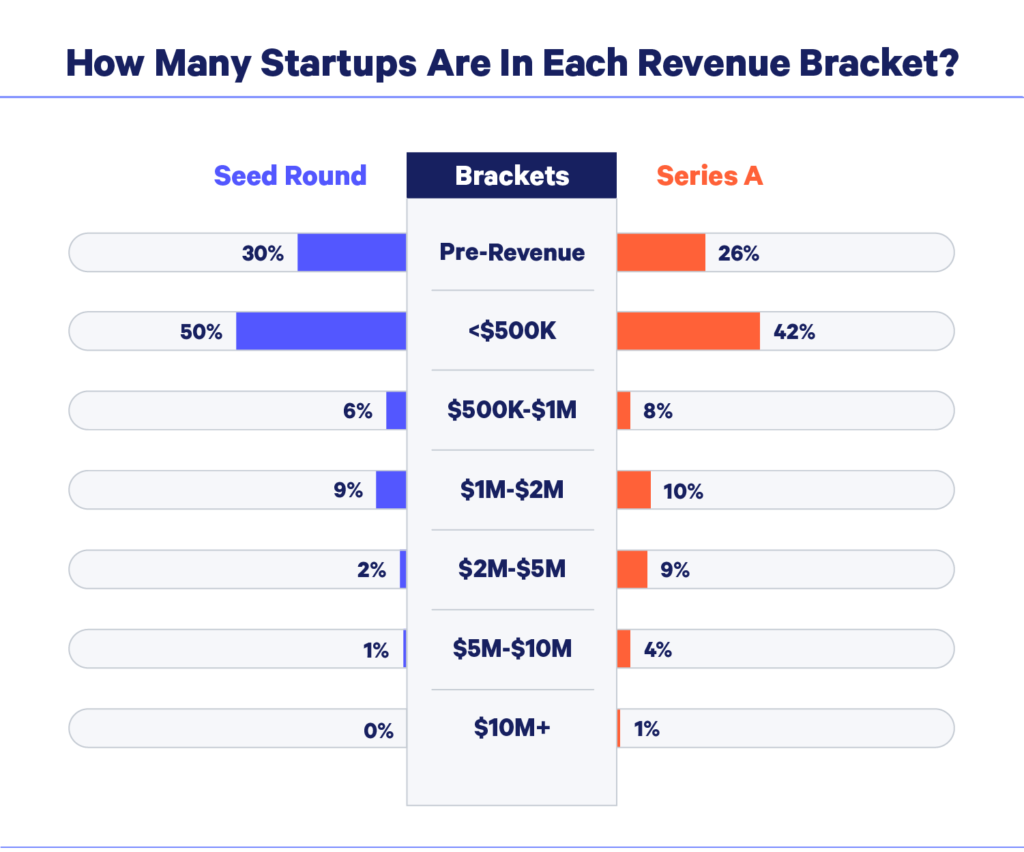
Data for the percentage of startups by revenue brackets unearthed additional findings, showing that lower revenue companies are fully capable of acquiring capital — 28% started acquiring capital in the pre-revenue stage.
While many venture capitalists suggest an average annual recurring revenue (ARR) of $1.4 million before a company is ready to raise Series A, the average revenue of startups that moved onto Series A rounds were slightly under that mark at $812,778.
Employee Averages
Among the many challenges that startups face, finding, attracting, and selecting the right employees is often a struggle. Early on, startups lack the hiring resources, employer brand and compensation packages that their more established counterparts offer. Then, there’s the challenge of scaling.
In the beginning, the goal of a startup is to search for a repeatable and scalable business model. It typically takes multiple iterations and pivots to find product/market fit, and that’s where the majority of resources and time are allocated. It’s a phase of trial and error and “do what it takes.” However, companies start to struggle when they move north of the 40 employee mark. While the “do what it takes” mantra can work efficiently on a small scale, informal culture has a tendency to become chaotic and less effective when growing a team.
At this stage, startups need to think about culture, training, product management, and processes and procedures, (i.e. writing the HR manual, expense reports, branding guidelines, etc.). Often referred to as the build phase, this is a turning point for startups that typically begins when they reach the 40 employee mark and can last to at least 175. These venture-backed startups will often have raised Series B, C, or later rounds during this phase compared to earlier phases.
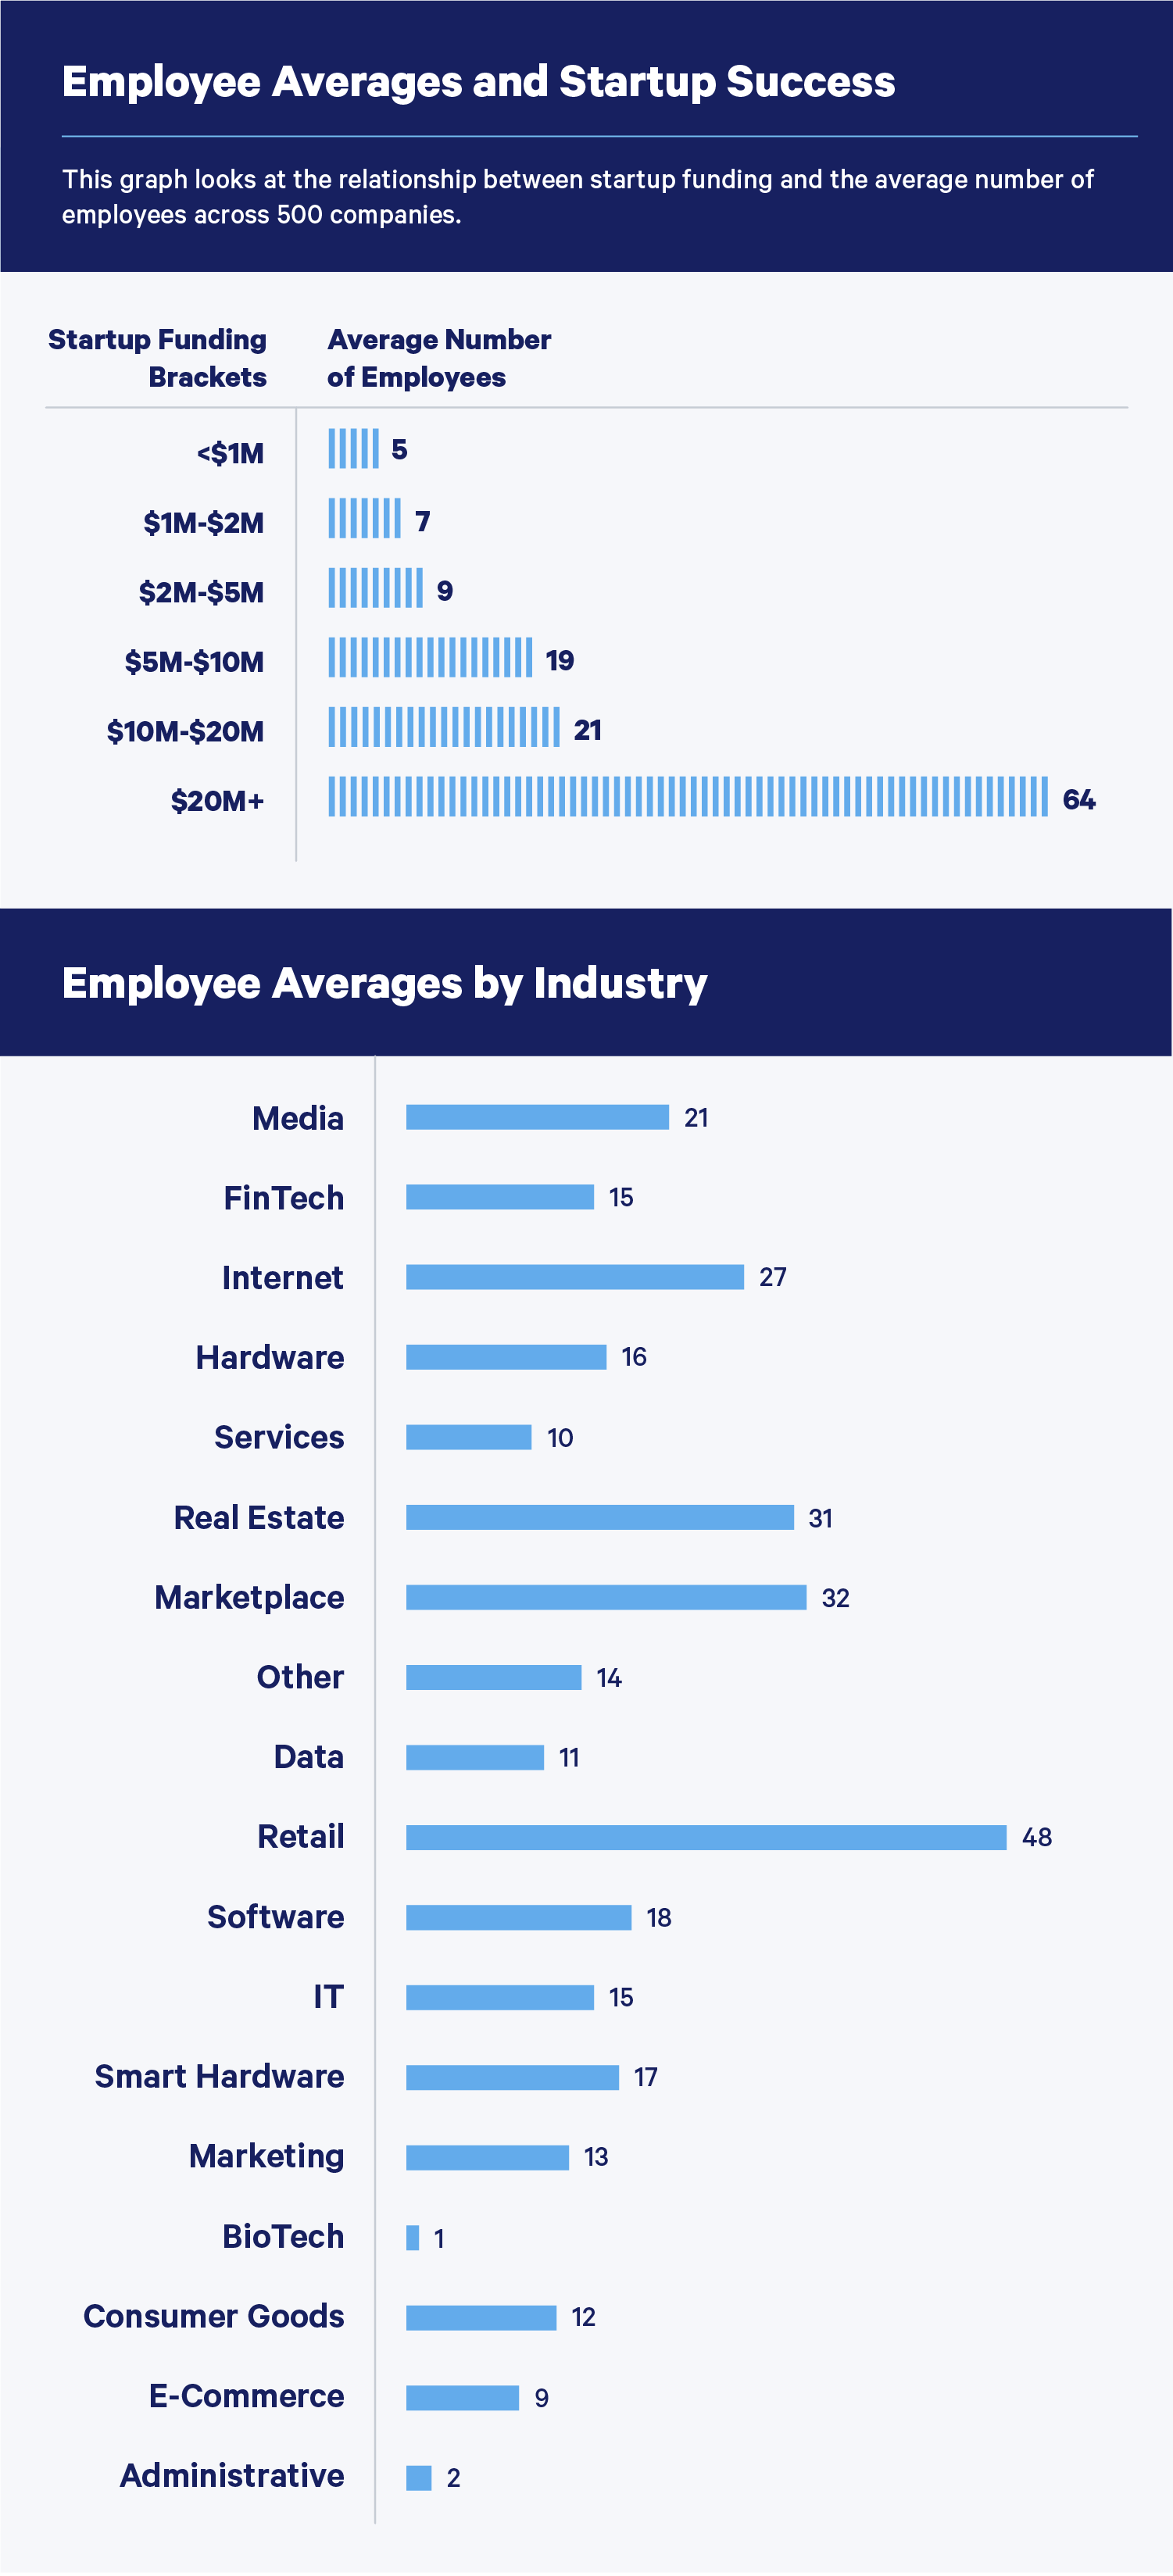
To better understand the relationship between company size and success, we looked into employee counts and funding data across approximately 500 startups — the majority of which are well under the 40 employee mark.
The state of VC funding is undoubtedly complex. The goal of this data is to shed some light on funding medians and averages in 2019 that aren’t necessarily represented in large-scale funding reports.
Whether you want to learn more about startups, you’re a founder who’s working to become the next unicorn or part of a company that’s preparing for funding, there are undoubtedly many things to consider. From hiring directors and officers to crafting your next pitch deck, it’s important to stay up to date on trends in the VC ecosystem. Embroker’s here to make sure you cover your bases with the right startup insurance policy for your business.
Sources: Crunchbase | Pitchbook


